Deployed solution walkthrough
- Audience: Retail, analytics, and technology stakeholders
- Duration: 3-5 minute orientation; 15-25 minutes for the full walkthrough
- Data: Synthetic
Use this guide for a browser-first tour of a deployed Microsoft Fabric Retail Demo workspace. It complements the presenter demo, which contains the detailed talk track and support boundaries.
Representative screenshots
The screenshots show a representative deployment. Fabric navigation, generated values, item counts, and data timestamps can vary by deployment and run date. Validate freshness before presenting any value as current.
Before you start
- Complete Getting started.
- Open the deployed Fabric workspace.
- Confirm that
retail_lakehouse,retail_eventhouse, the KQL queryset,retail_model, the pipelines and notebooks, and any optional ontology or agent items you plan to show are available. - Run the historical setup notebooks. Run
stream-events.ipynbonly when the walkthrough needs recent Eventhouse data.
1. Orient the audience in the workspace
Open the workspace task flow and select the Retail Demo flow.
Task flow is a full-demo experience
The task flow is published only after the full-demo ontology step is
complete. If the workspace uses core or standard, skip this step and
open the workspace item list. You can still follow the historical, live,
and Reporting paths described below.
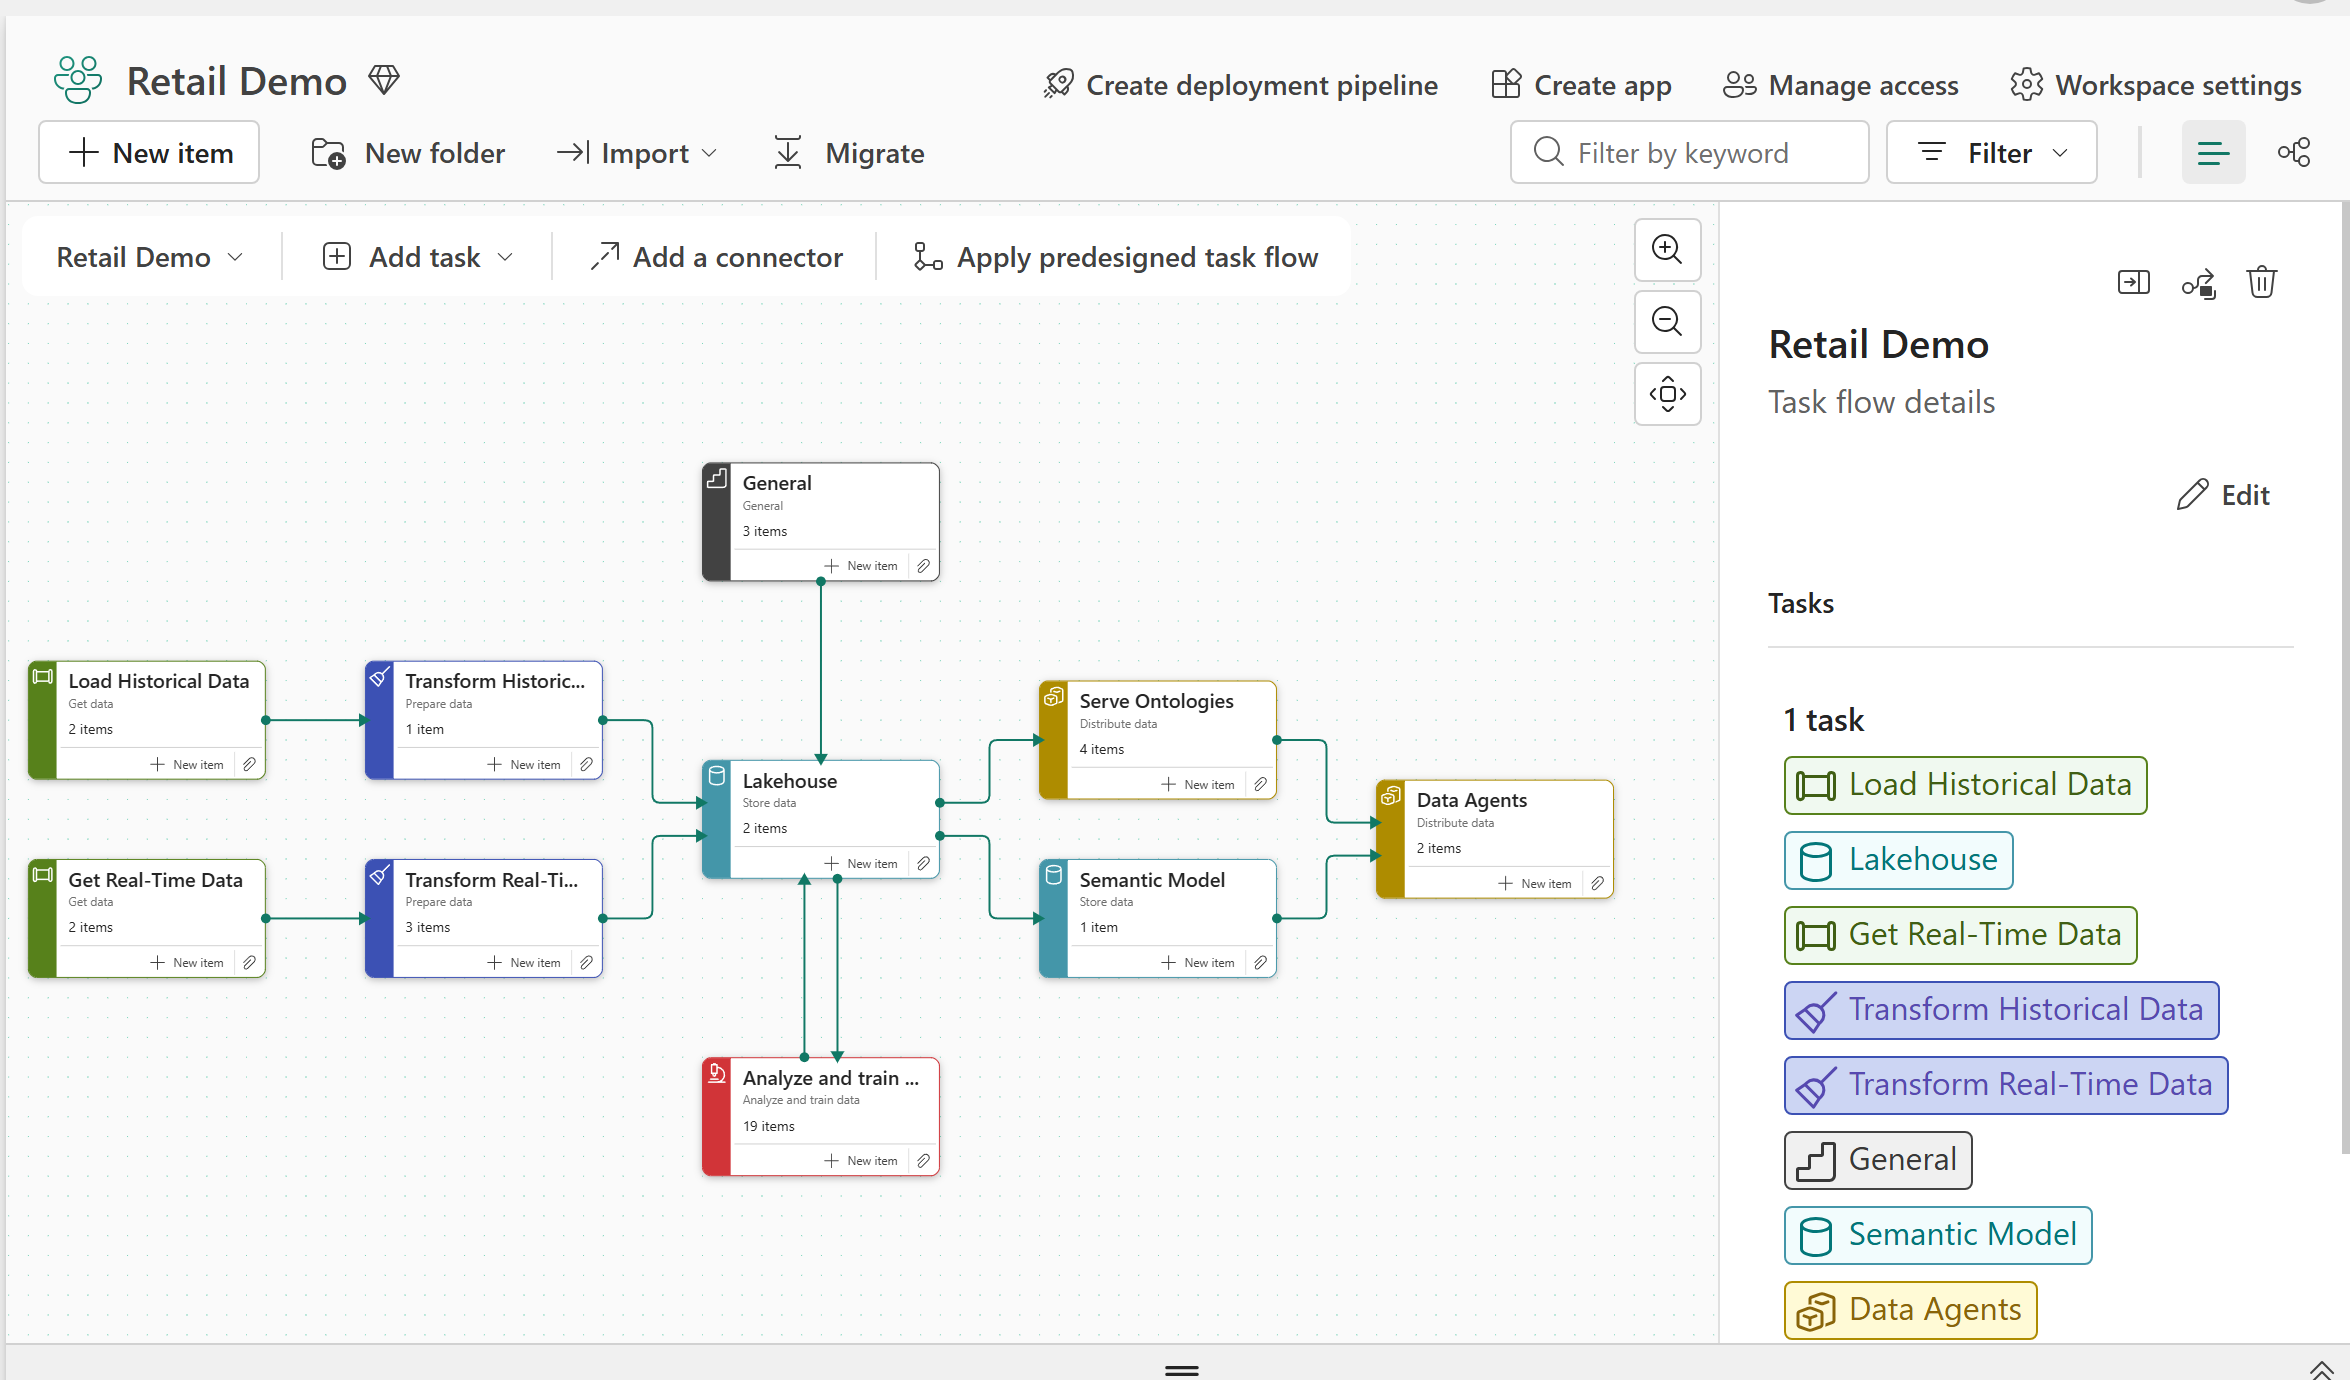
The task flow groups ingestion, transformation, storage, semantic, ontology, ML, and agent assets into one workspace-level map. Required ML points into the Semantic Model; post-Reporting optional and experimental ML points out from it so those extensions are not presented as Reporting prerequisites.
Use the flow to explain three paths:
- Historical: load and transform deterministic retail history into the Lakehouse.
- Live: send typed retail events to Eventhouse and optionally project them into Lakehouse tables.
- Serving: expose curated data through the semantic model, Power BI, ontology, and data-agent surfaces.
The task flow is a navigation aid. It does not prove that a notebook, pipeline, or stream completed successfully.
Continue the walkthrough
Choose the page that matches the audience:
| Walkthrough | Use it for |
|---|---|
| Data platform | Pipelines, Spark notebooks, Lakehouse history, and Eventhouse/KQL |
| Analytics and AI | Ontology, grounded data-agent answers, and the Power BI report |
For the complete demo, present the data platform first and finish with analytics and AI. For a business audience, use this overview and go directly to Analytics and AI.
Shared support boundaries
- Screenshots show a representative deployment; item counts, values, and timestamps vary.
- A task-flow node or pipeline canvas is navigation context, not execution evidence.
- Validate the selected data period before discussing any value.
- Skip optional ontology, agent, ML, or live-streaming surfaces that have not passed their source, permission, and capability checks.
What to check during the walkthrough
| What you open | What a ready workspace should show |
|---|---|
| Open the Retail Demo task flow | Historical, live, storage, semantic, ontology, ML, and agent tasks are visible. |
| Open the Data platform guide | Pipeline, notebook, Lakehouse, and Eventhouse steps are available without analytics detail. |
| Open the Analytics and AI guide | Ontology, agent, and report steps are available without implementation detail. |
For a timed presentation, continue with the presenter demo or a focused presenter journey.